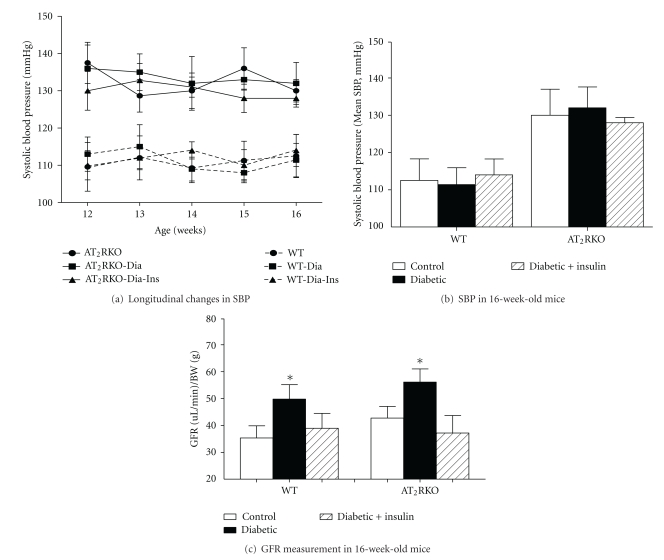
Figure 2.
(a) Longitudinal and cross-sectional changes in mean SBP in 3 subgroups (e.g., control (●), diabetic (■), and insulin-treated diabetic (▲)) of WT (broken line) and AT2RKO male mice (solid line) from the age of 12 to 16 weeks. (b) Mean SBP in 3 groups control (open bar), diabetic (black bar), and insulin-treated diabetic (shadowed bar) of WT and AT2RKO male mice at the age of 16 weeks. (c) GFR in 3 groups (control (open bar), diabetic (black bar), and insulin-treated diabetic (shadowed bar)) of WT and AT2RKO male mice at age 16 weeks. *P ≤ 0.05.

