
Figure 4.
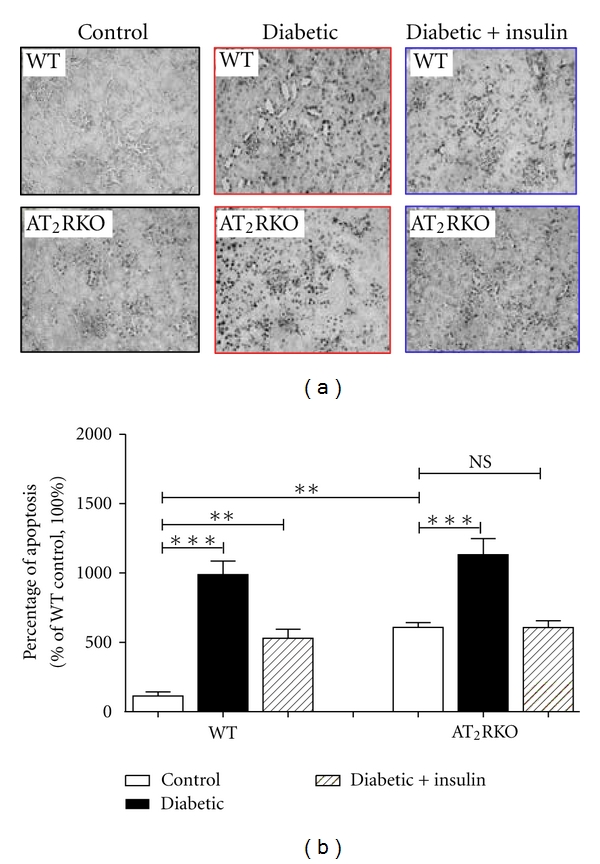
(a) TUNEL assay (magnification 200X) in the kidneys of 3 subgroups [control (open bar), diabetic (black bar) and insulin-treated diabetic (shadowed bar)] of WT and AT2RKO male mice at age 16 weeks. (b) Semi-quantitation of apoptotic cells in the kidneys. The y-axis shows the fold increase of apoptotic cell number in the kidneys of 3 subgroups of mice. **P ≤ 0.01; ***P ≤ 0.001; NS, non-significant.