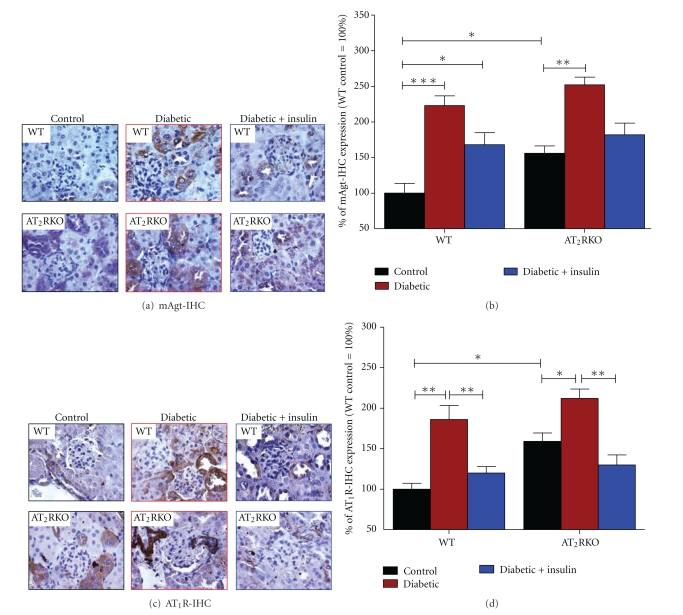
Figure 7.
IHC staining of mAgt (a) and (b) and AT1R (c) and (d) genes. (a) and (c) IHC images of Agt and AT1R in the kidneys of 3 subgroups of both WT and AT2RKO male mice (magnification 600X). (b) and (d) Semiquantification of IHC expression in the kidneys of 3 subgroups (control (black bar), diabetic (red bar), and insulin-treated diabetic (blue bar)) of WT and AT2RKO male mice. The y-axis shows the percentage of relative staining values compared to WT control animals (100%). *P ≤ 0.05; **P ≤ 0.01; ***P ≤ 0.001.

