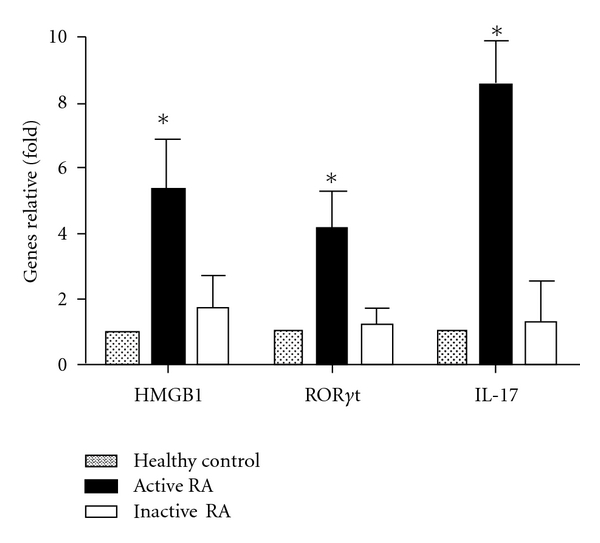
Figure 1.

Expression of gene ratio by RT-qPCR. The mRNA expression level were determined by RT-qPCR, the values were expressed as the fold of the healthy control. the ratio of target genes used the healthy control as 1. *P < 0.05 compared with the healthy control and inactive RA group.
