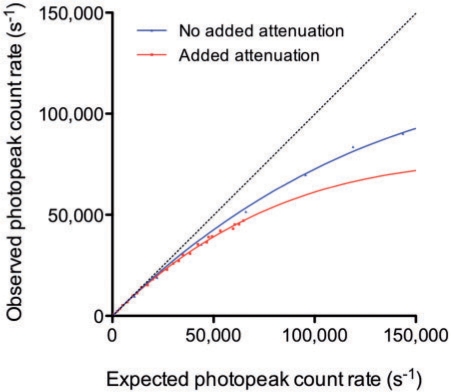
Figure 4.
Observed photopeak count rate versus expected photopeak count rate, with (red) and without (blue) added attenuating/scattering medium surrounding the 177Lu sources. The solid line curves are the result of Sorenson’s paralyzable model fit. The dotted line is the line of identity. At a given observed count rate, the apparent dead-time varies depending on the attenuation/scatter conditions.

