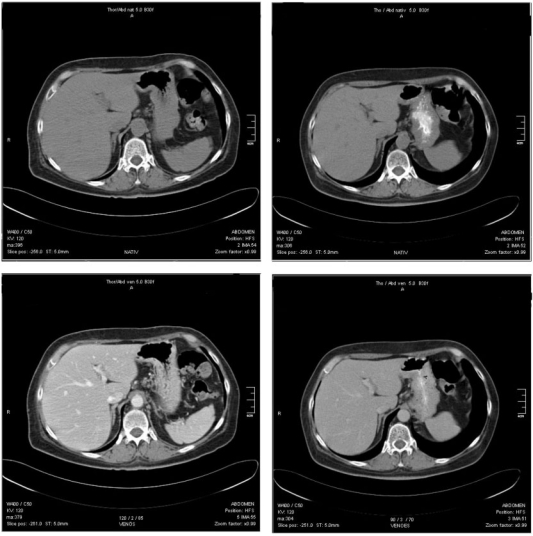
Figure 4.
Top: plain CT of one patient; baseline (left), follow-up (right); note the less decreased density of liver parenchyma; baseline 54.3 HU, follow-up 61.4 HU. Bottom: same patient portal venous phase; baseline (left), follow-up (right); note the significantly decreased contrast, baseline 126.6 HU, follow-up 89.2 HU.

