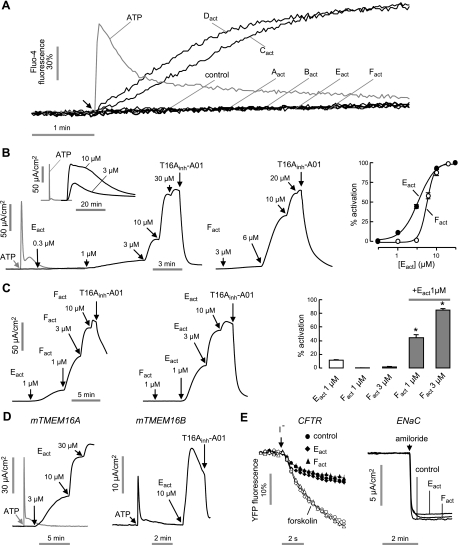
Figure 2.
Characterization of TMEM16A activators. A) Cytoplasmic calcium measured by Fluo-4 fluorescence. Arrow indicates addition of 100 μM ATP (gray line) or 10 μM of indicated TMEM16A activators. B) Apical membrane current measured in TMEM16A-expressing FRT cells in the presence of a transepithelial chloride gradient and after basolateral membrane permeabilization. Left and center panels: representative current traces showing ATP (100 μM), Eact- or Fact-stimulated TMEM16A Cl− current. T16Ainh-A01 (10 μM) was added where indicated. Inset shows long-time Eact effect. Right panel: concentration-activation data summary (mean±se, n=4–6). C) Synergistic effect of Eact and Fact. Left and center panels: representative current traces showing synergy. Right panel: data summary of low doses of TMEM16A activation (mean±se, n=5). *P < 0.05. D) Apical membrane current measured in FRT cells transfected with mouse TMEM16A or TMEM16B. E) Effect of Eact and Fact on CFTR and ENaC. Left panel: FRT cells expressing wild-type CFTR and YFP indicator were pretreated for 5 min with 10 μM Eact and Fact. Forskolin (10 μM) was added as indicated. Right panel: HBE cells were pretreated for 5 min with 10 μM Eact and Fact, with amiloride (10 μM) added as indicated.

