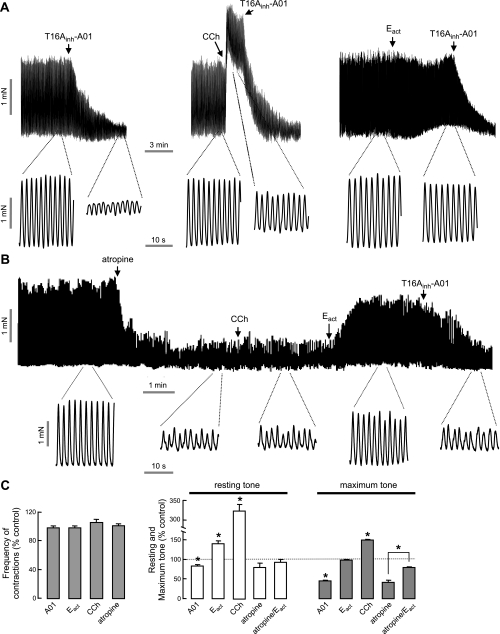
Figure 9.
Intestinal smooth muscle contraction. A) Representative traces from mouse ileal segments showing effects of T16Ainh-A01 (10 μM), carbachol (CCh, 1 μM) and Eact (10 μM). B) Effect of CCh (1 μM) and Eact (10 μM) following atropine (1 μM). C) Summary of contraction frequency (left panel) and resting and maximum tone (right panel; mean±se, n=4–7). *P < 0.05.

