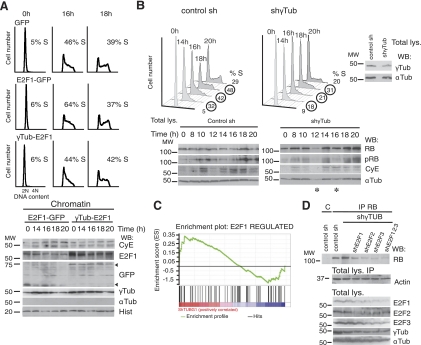
Figure 6.
Variations in γ-tubulin levels affect cell cycle progression. A) Cell cycle distribution of synchronous control (GFP)-, E2F1 and GFP (E2F1-GFP)-, or E2F1 and γtubGFP (γTub-E2F1)-transfected NIH3T3 cells. Cells were synchronized in G0 and released for different time periods, and DNA content of the samples was determined by flow cytometry. Percentage of S-phase cells is indicated in each panel (n=4). Extracts from synchronous NIH3T3 cells transfected with E2F1 and GFP or E2F1 and γtubGFP were prepared as in Fig. 1A and examined by WB using the indicated antibodies (n=4). Arrowheads indicate various GFP-fused proteins. B) Cell cycle distribution of synchronous control shRNA- or γ-Tubulin-shRNA-transfected NIH3T3 cells. Cells were synchronized in G0 as in A and released for different time periods, and DNA content of the samples was determined by flow cytometry. Percentage of S-phase cells is indicated in each panel (n=3). Synchronous control shRNA- or γ-Tubulin-shRNA-transfected NIH3T3 cells were analyzed using the indicated antibodies (n=3). Total lysate was run in parallel as control for γ-tubulin levels and as loading control (indicated). Asterisks indicate lanes with variation in protein loading (n=3). C) GSEA of E2F1-upregulated gene set performed on a ranked gene list of differentially expressed genes between γ-TUBULIN-shRNA-transfected (n=4) and control-shRNA-transfected (n=5) cells. Genes were ranked in descending order with regard to level of expression in γ-TUBULIN-shRNA-transfected cells. (enrichment score 0.34, nominal P=0.026). D) U2OS cells expressing indicated constructs were used for immunoprecipitation of RB with anti-RB or control (C) antibody. Total lysate was run as loading control (bottom panels; n=3).

