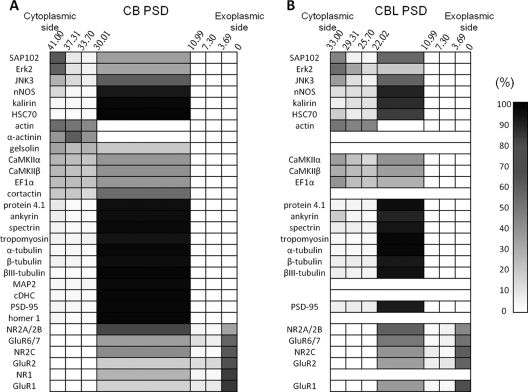
Fig. 8.
Distribution of various proteins in cerebral PSD (A) and cerebellar PSD (B). The distribution of various proteins in cerebral and cerebellar PSDs is shown in cell plots with the ni/N and I/N values, as indicated by a gray-colored gradient shown to the right, of a particular protein (y axis) residing in different depth ranges in the PSD (x axis, with the edges on the exoplasmic and cytoplasmic sides being at 0 and 41 nm respectively in cerebral PSD and with the edges on the exoplasmic and cytoplasmic sides being at 0 and 33 nm respectively in cerebellar PSD).

