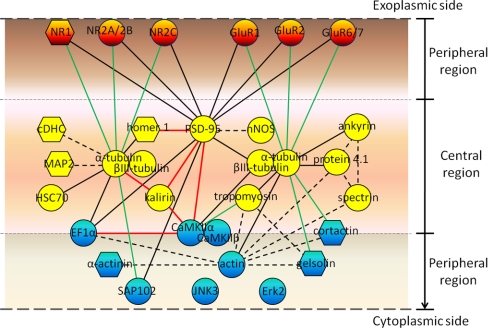
Fig. 9.
A model of the protein organization of the PSD. The proteins subject to study here are placed in the positions as in Fig. 8, and interactions between different protein pairs are connected by solid or broken lines of different colors. Symbols: solid lines, protein-protein interactions identified in this study; broken lines, protein-protein interactions reported earlier in the literature; black lines, protein-protein interactions identified in both cerebral and cerebellar PSDs; red lines, protein-protein interactions identified in cerebral PSD only; green lines, protein-protein interactions identified in cerebellar PSD only; circles, proteins with localization identified in both cerebral and cerebellar PSDs; hexagons, proteins with localization identified in cerebral PSD only. The interactions between proteins could be direct or indirect. Peripheral proteins facing the exoplasmic side and cytoplasmic side of the PSD are colored in orange and blue, respectively. Central proteins are colored in yellow. EF1α, CaMKIIα, CaMKIIβ, and cortactin are placed on the border between the central and cytoplasm-facing peripheral regions to indicate that these proteins reside in both regions.

