Fig. 2.
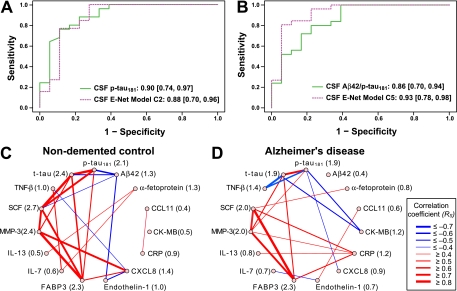
Pathology associated CSF communicome models can classify AD and NDC and the connectivity network of the proteins in these models is altered in AD patients. A, B, CSF pathological markers or CSF Elastic net (E-net) models C2 and C5 were used to calculate ROC curves. The color-coding is based on Fig. 1 and the numbers indicate the AUC values and 95% C.I. (listed also in Table II). A, CSF samples from AD patients and NDC were classified based on levels of CSF p-tau181 (solid green line) or levels of CSF communicome proteins (FABP3, CCL11, endothelin-1, CK-MB, IL-13, CXCL8) and APOE4 status selected in model C2 (dashed purple line). B, CSF samples from AD patients and NDC were classified based on levels of CSF Aβ42/p-tau181 (solid green line) or levels of CSF communicome proteins (FABP3, IL-13, SCF, CK-MB, α-fetoprotein, endothelin-1, CRP) and APOE4 status selected in model C5 (dashed purple line). C, D, Network diagrams illustrating connectivity between CSF pathological markers and CSF communication factors selected in models C1–C5. The connectivity between two proteins is expressed as Spearman rank correlation coefficient RS calculated from all measurements for these two proteins in CSF samples of nondemented controls (C) or AD patients (D), respectively. The correlations are visualized in a network with different strokes and colors depending on strength and type of connectivity among proteins. Red strokes RS ≥ 0.4, blue strokes RS ≤ –0.4. In parentheses next to the name of the analyte is the interaction score, which is the sum of the squared values of all RS among all analytes in the connectivity diagram. Note the considerable change of the interaction scores between communication factors in AD patients (D) compared with NDC (C).

