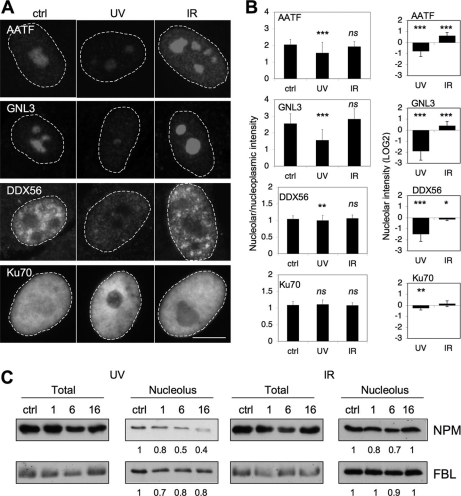
Fig. 6.
Immunofluorescence and immunoblotting analysis of selected nucleolar proteins. A, WS1 cells were treated with UV (35 J/m2) and IR (10 Gy) and fixed after 16 h. Cells were stained for AATF, GNL3 (nucleostemin), DDX56, and Ku70 proteins and imaged using widefield fluorescence microscopy. Scale bar, 10 μm. B, Ratios between nucleolar and nucleoplasmic intensities and LOG2 changes in nucleolar intensity as compared with control are shown. Error bars, S.D. n = 25–158 cells. **p < 0.01; ***p < 0.001; ns, nonsignificant. C, WS1 cells were treated as above and harvested at 1, 6 and 16 h postdamage. Cells were extracted with urea buffer and isolated nucleoli were resuspended directly in Laemmli sample buffer and sonicated briefly. Equal numbers of nucleoli or total protein were separated by SDS-PAGE and immunoblotted for FBL and NPM.

