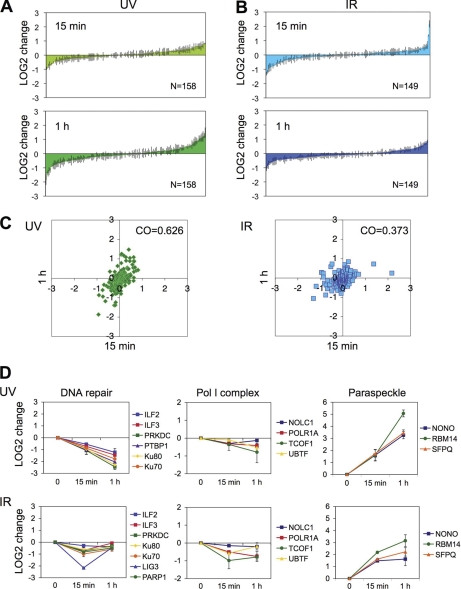
Fig. 7.
Rapid IR damage responses of the nucleolar proteome. A, Changes in LOG2 values of proteins in UV-treated cells (35 J/m2) at 15 min and 1 h postdamage as compared with control. Error bars, S.D. B, Changes in LOG2 values of proteins in IR-treated cells (10 Gy) at 15 min and 1 h postdamage as compared with control. Error bars, S.D. C, Rapid kinetic changes in the nucleolar proteome following UV and IR treatments. LOG2 values at 15 min (x axis) were compared with those at 1 h (y axis). Correlation coefficiencies (CO) were measured for each set. D, Profiles of DNA repair proteins, RNA polymerase I (Pol I) complex proteins and paraspeckle proteins are plotted as normalized LOG2 values as compared with control over time. UV and IR treatments are indicated. Error bars, S.D.

