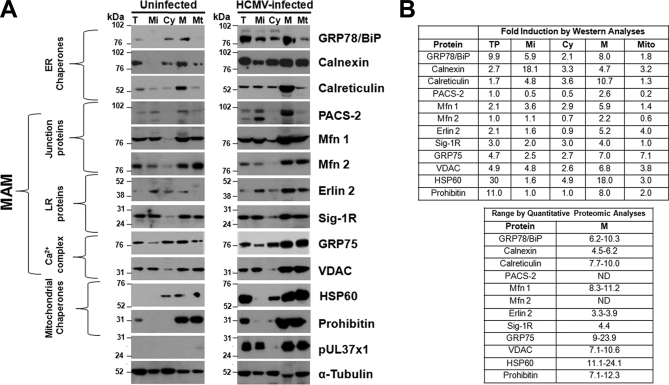
Fig. 6.
A, Verification of quantitative MAM proteomic results using Western analyses. HFFs were uninfected (left) or HCMV-infected (right). At 72 hpi, microsomal (Mi), cytosol (Cy), heavy MAM (M), mitochondria (Mt) were isolated as previously described (28, 47). Proteins in total (T) lysates (30 μg) or indicated fractions (10 μg) were resolved by SDS-PAGE and analyzed by Western analyses using ER chaperones (anti-GRP78/BiP, -calnexin, -calreticulin), MAM junction (anti-PACS-2, -Mfn 1, -Mfn 2), MAM lipid rafts (anti-erlin 2, Sig-1R), MAM Ca2+ signaling complex (anti-GRP75, -VDAC) and mitochondrial chaperones (anti-HSP60, -Prohibitin). The presence of pUL37×1 was verified by anti-UL37×1 (DC35) and α-tubulin was used as a loading control. B, Comparison of HCMV induction of key proteins associated with the MAM calculated by Western analyses (top) or quantitative proteomic analyses (bottom). Top right: The HCMV induction for each protein was calculated for each fraction in the Western analyses (Panel A) by comparing the indicated protein levels in HCMV-infected cells normalized to α-tubulin levels and then divided by the protein levels in uninfected cells normalized to α-tubulin levels. Bottom right: The range of HCMV induction of each protein was determined by quantitative proteomics as in Tables I and III. ND: Proteins were not detected by MS/MS analyses. Prohibitin data from quantitative proteomics were not shown.

