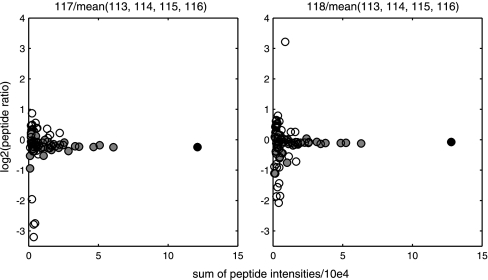
Fig. 2.
Outlier detection for quantification of isoform A1-B of the heterogeneous nuclear ribonucleoprotein A1. Each spot represents one peptide of the protein from data set II (colon cell line samples) quantified by 8-plex iTRAQ. Each graph shows one sample related to the mean of the control samples represented by iTRAQ reporter ions 113, 114, 115, and 116. The ratios (x axis) are plotted against the sum of the ingoing peptide intensities (y axis) from MALDI MS data, extracted from Protein Pilot. The filled circles are the ratios accepted as quantitative accurate by PQPQ. The outlier peptides are marked as empty circles. The “model peptide” is black. In this specific case the precision (standard deviation) of the protein ratio were improved from 0.87 to 0.097 and 0.90 to 0.14 for the respective ratios by outlier exclusion.

