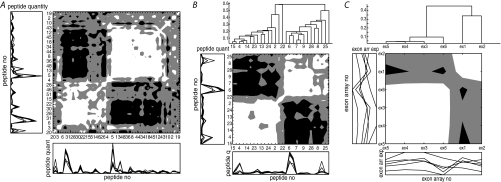
Fig. 3.
Correlation maps of the peptides and exon arrays associated to beta actin. The presented data are from data set I, sample pool 2. White means positive correlation, Pearsons correlation R2 > 0.33. Black is negative correlation, R2 < –0.33. Gray means 0.33 > R2 > –0.33. A–B, The peptides are identified by Protein Pilot from MALDI TOF/TOF MS data of 8-plex iTRAQ labeled lung cancer tumor samples and associated to beta actin by the Paragon algorithm. A, All peptides associated uniquely to the protein beta actin (52 peptides). B, Only the high confident peptides (28 peptides). C, The six exon mRNA arrays analyzed for beta actin and how the quantities are correlating over the samples.

