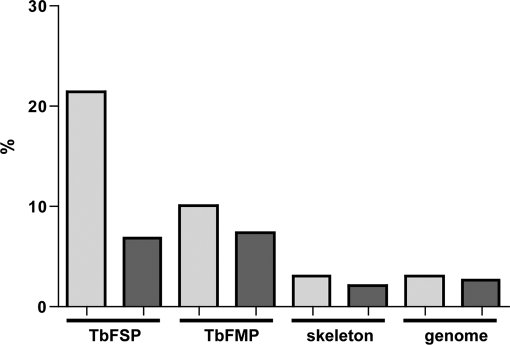
Fig. 10.
Flagellum surface proteins are up-regulated in bloodstream-form cells. Chart shows the percentage of proteins in each proteomic dataset that are up-regulated in bloodstream-form cells (light gray bars) or procyclic-form cells (dark gray bars) by twofold or more based on RNA sequencing analysis (68). Proteomic data sets are for the flagellum surface (TbFSP), the flagellum matrix (TbFMP), and the flagellum skeleton (TbFP) proteomes (31, 43, 46).

