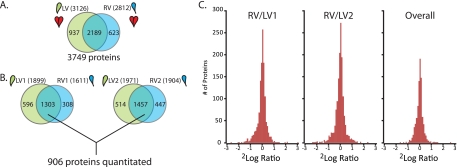
Fig. 2.
Quantitative comparison of the LV and RV proteome. A, Qualitative comparison of identified proteins in the combined LV and RV experiments (two mice). B, Overlap between proteins quantified in mouse1+SILAC (left) and mouse2+SILAC (right) and proteins quantified in each of the four runs of the whole experiment (906 proteins). C, Histogram of observed protein ratios (RV/LV) shows very few proteins with a large difference between LV and RV in both the individual experiments as well as the combined 906 proteins of mouse1 and mouse 2 (see also supplemental Figs. S3, S4, and S5).

