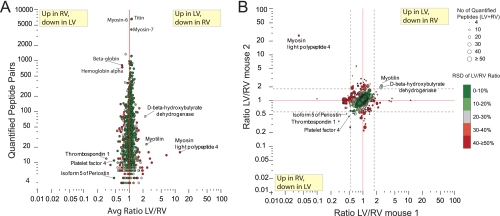
Fig. 3.
Detailed Quantitative comparison of LV and RV. A, Average ratio LV/RV from both mice plotted against the amount of quantitated peptide pairs shows only marginal differences between LV and RV at the lower end. Proteins with larger differences and many spectra are either caused by large relative standard deviations (RSD) on the quantitation (red data points, color coding, see legend) or slight differences in blood component contamination. B, Quantitative results from mouse 1 compared with mouse 2 show high consistency in unchanged proteins, however no proteins with a large difference in concentration between LV and RV could be observed (should scatter along y = x with large ratio), except some of the highlighted proteins with thrombospondin 1 and myotilin as most prominent representatives (consistent ratio above 1.96*sd (standard deviation) in both mice and low RSD). Lines represent the 95% confidence intervals calculated through average ratio ± 1.96 standard deviations. Colors represent relative standard deviation (RSD) on LV/RV ratio over both experiments (see legend).

