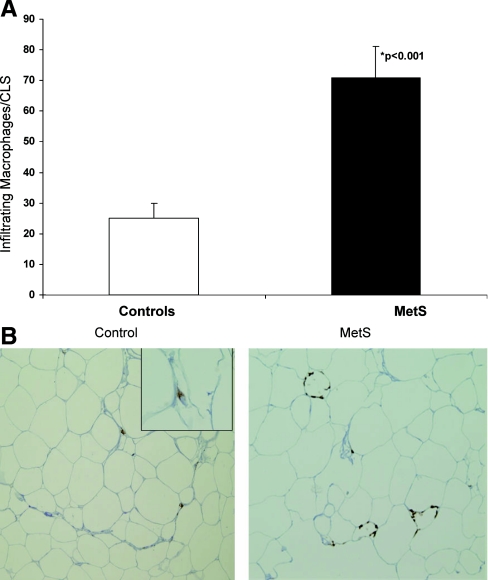
Fig. 1.
A, Number of infiltrating macrophages in adipose tissue of controls and subjects with MetS. The number of macrophages including CLS per 10 hpf were counted after immunohistochemistry and staining with CD68 as detailed in Subjects and Methods. *, P < 0.001 compared with control. B, Representative SAT biopsy specimens from controls and subjects with MetS (hematoxylin and eosin stain). Note the macrophages arranged adjacent to the adipocyte cell membrane forming a CLS in the SAT from the MetS subject. The images shown are at ×20 magnification; inset of the control is at ×40 magnification.

