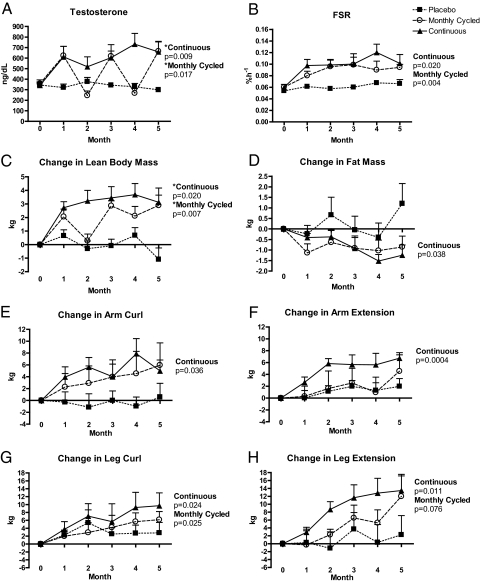
Fig. 1.
A, Total testosterone; B, mixed-muscle FSR; C, change in LBM; D, change in fat mass; E, change in arm curl; F, change in arm extension; G, change in leg curl; H, change in leg extension. *, Significantly different from PL (ANOVA, P < 0.05). P values indicate changes between months 0 and 5 (t test). One MO subject missed his month-2 study visit due to a personal scheduling conflict, and three subjects missed study visits due to Hurricane Ike (two TE subjects missed months 2 and 3, respectively, and one MO subject missed month 4). DXA data from one subject were unavailable at months 3 and 5 due to a technical issue with the DXA machine. Month-4 DXA data from this subject were used for before vs. after comparisons and did not impact our findings. DXA data include four individuals (one PL and three TE) that were analyzed on a different machine at month 5 vs. month 0. Exclusion of these data strengthened the statistical significance of our results, and these data were included in our final statistical analysis offering the most conservative results.

