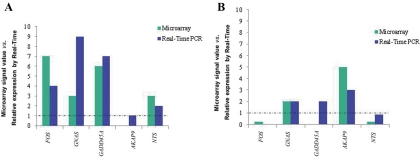
Fig. 1.
Microarray signal values and relative expression measured by real-time PCR for the genes FOS, GNAS, GADD45A, AKAP9, and NTS. Dotted lines indicate the expression of the corresponding genes in normal pituitaries. A, Studies performed in the MEN1-associated pituitary tumor, showing concordance with the expression pattern observed in microarray analysis, for all genes evaluated. B, Results from the sporadic pituitary adenoma. Except for GADD45A, the pattern of gene expression observed in microarray was confirmed by real-time PCR.

