
Figure 1.
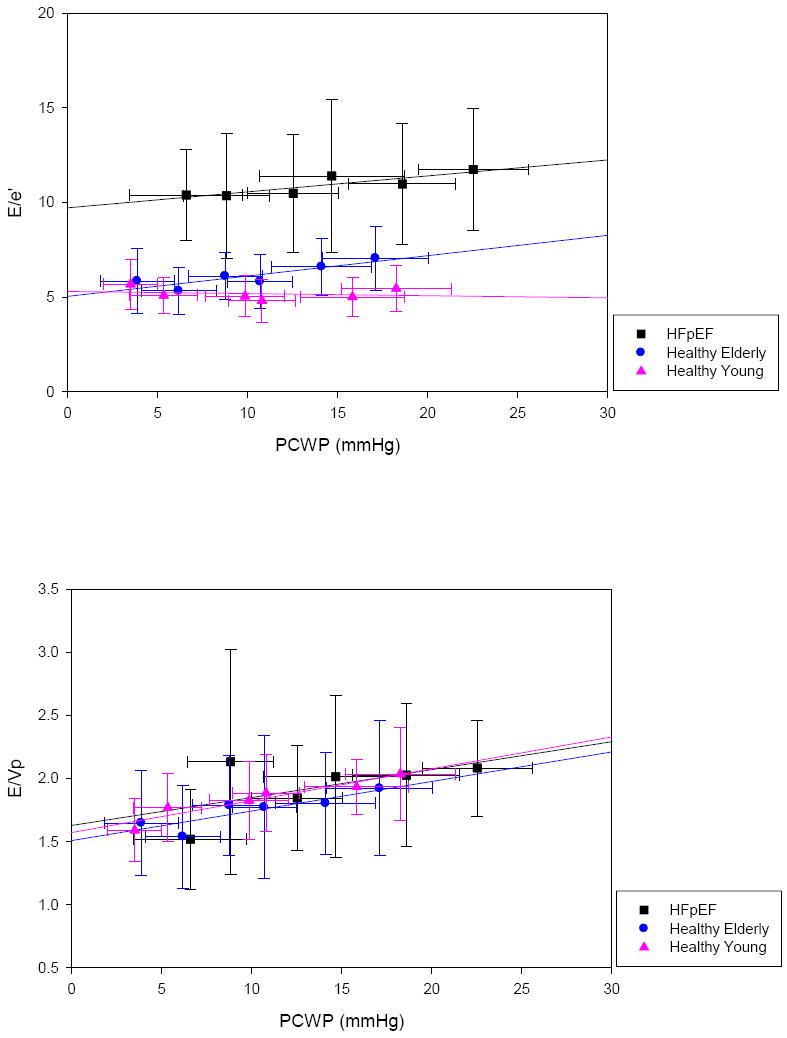
E/e’ (top) and E/Vp (bottom) across filling pressures. Data represent group means ± standard deviations at each stage of preload manipulation.
Official websites use .gov
A
.gov website belongs to an official
government organization in the United States.
Secure .gov websites use HTTPS
A lock (
) or https:// means you've safely
connected to the .gov website. Share sensitive
information only on official, secure websites.
E/e’ (top) and E/Vp (bottom) across filling pressures. Data represent group means ± standard deviations at each stage of preload manipulation.