
Figure 3.
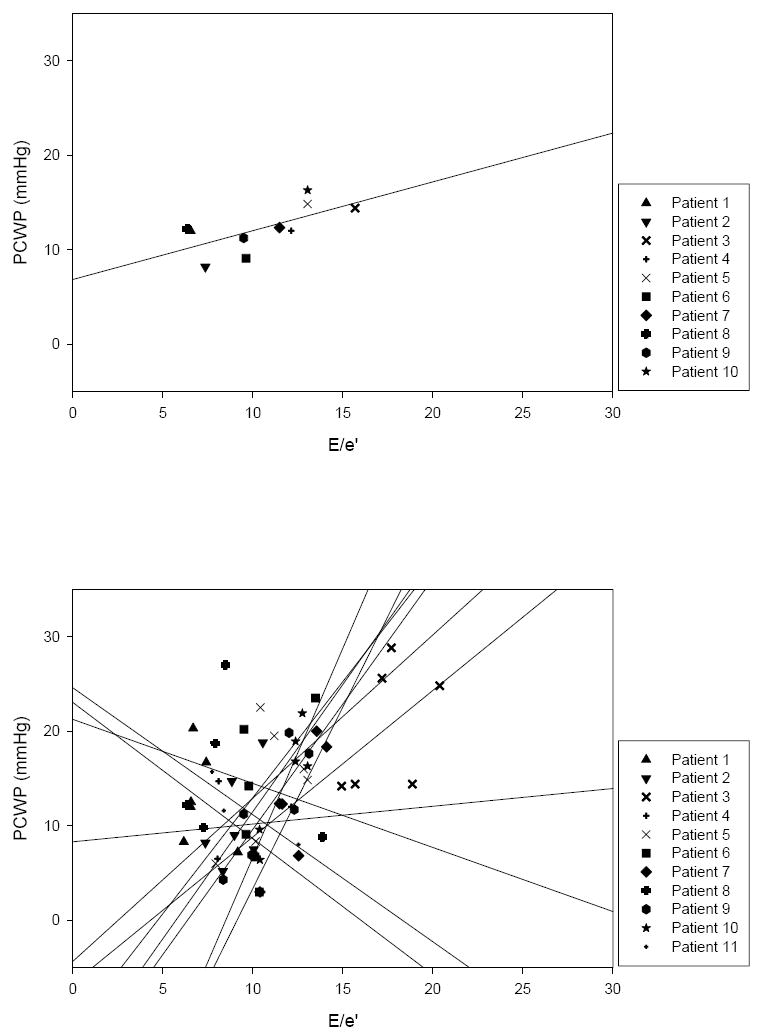
Top: E/e’ vs. PCWP in HFpEF patients at baseline with superimposed group linear regression (one HFpEF patient could not adequately imaged at baseline). Bottom: E/e’ vs. PCWP in individual HFpEF patients with superimposed linear regressions (note: linear regressions are extended to axes). Again, individual linear regressions were highly variable in regards to slope and r2.