
Figure 4.
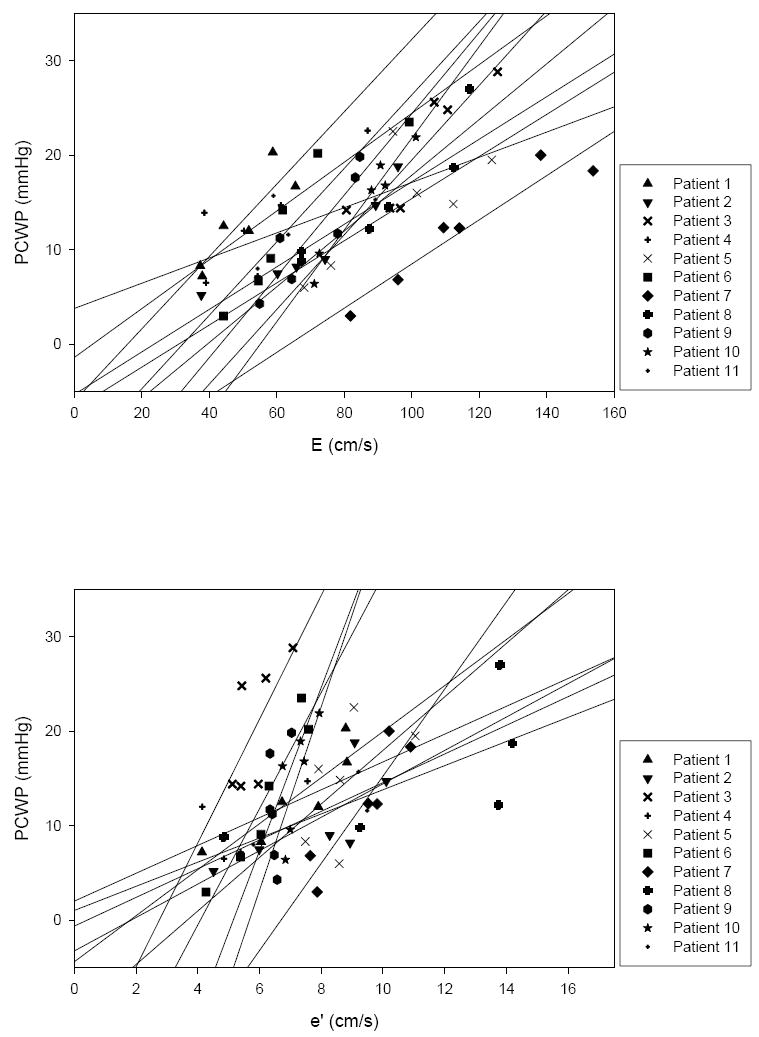
Top: E vs. PCWP in individual HFpEF patients with superimposed linear regressions. E demonstrated a degree of preload dependence which was similar between individual HFpEF patients. Bottom: e’ vs. PCWP in individual HFpEF patients with superimposed linear regressions. e’ varied greatly between individual HFpEF patients accounting for the broad variability observed in individual E/e’ slopes as preload was manipulated.