
Figure 5.
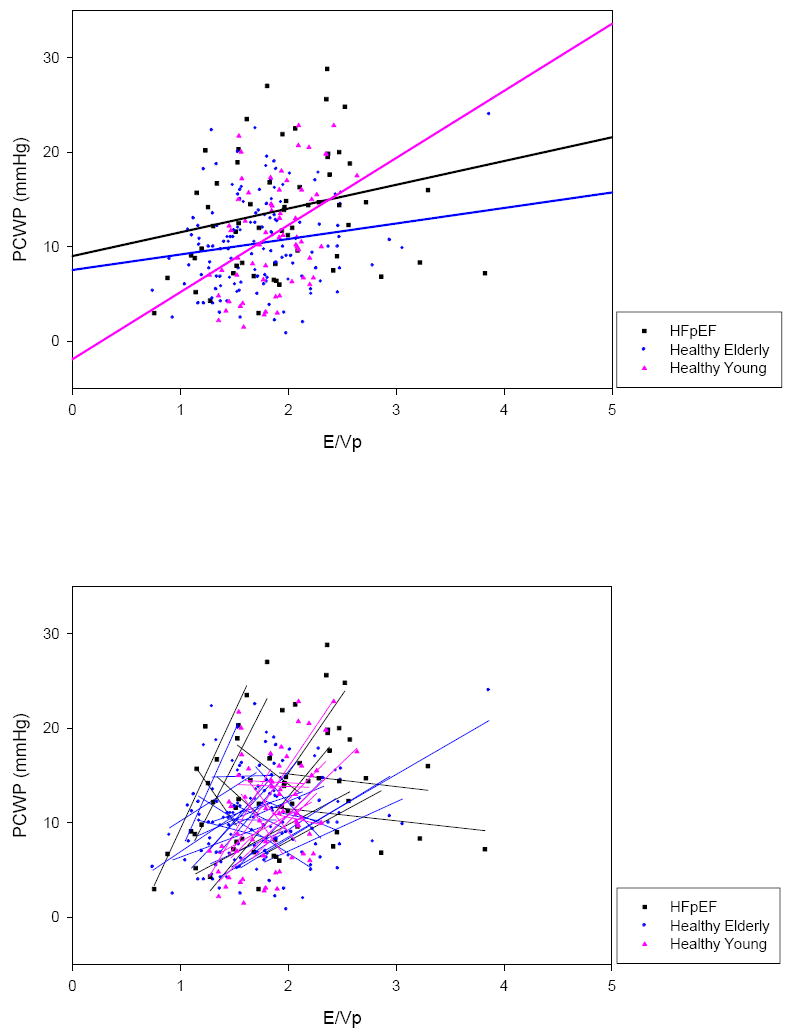
Composite of E/Vp vs. PCWP in all subjects. Group random coefficient mixed model regressions (top) and individual linear regressions (bottom) are superimposed. Again, individual linear regressions were highly variable in regards to slope and r2.