
Figure 6.
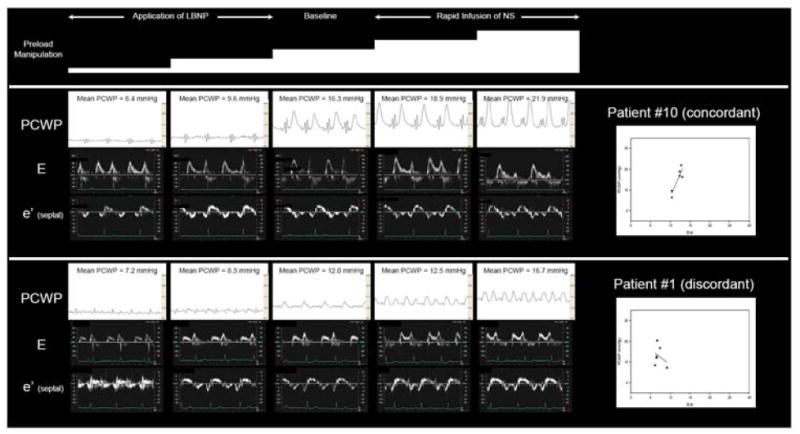
Effects of preload manipulation on PCWP, E, e’ and E/e’ slope in two HFpEF patients. In the top example, increasing PCWP results in a positive E/e’ slope demonstrating concordance between these measures. In the bottom example, increasing PCWP results in a negative E/e’ slope demonstrating discordance. In 8/11 HFpEF patients, PCWP and E/e’ were concordant whereas in the other 3, the two measures were discordant. Mean PCWP was determined during the period of diastasis, thereby minimizing the impact of large V waves on the mean PCWP observed in the top example.