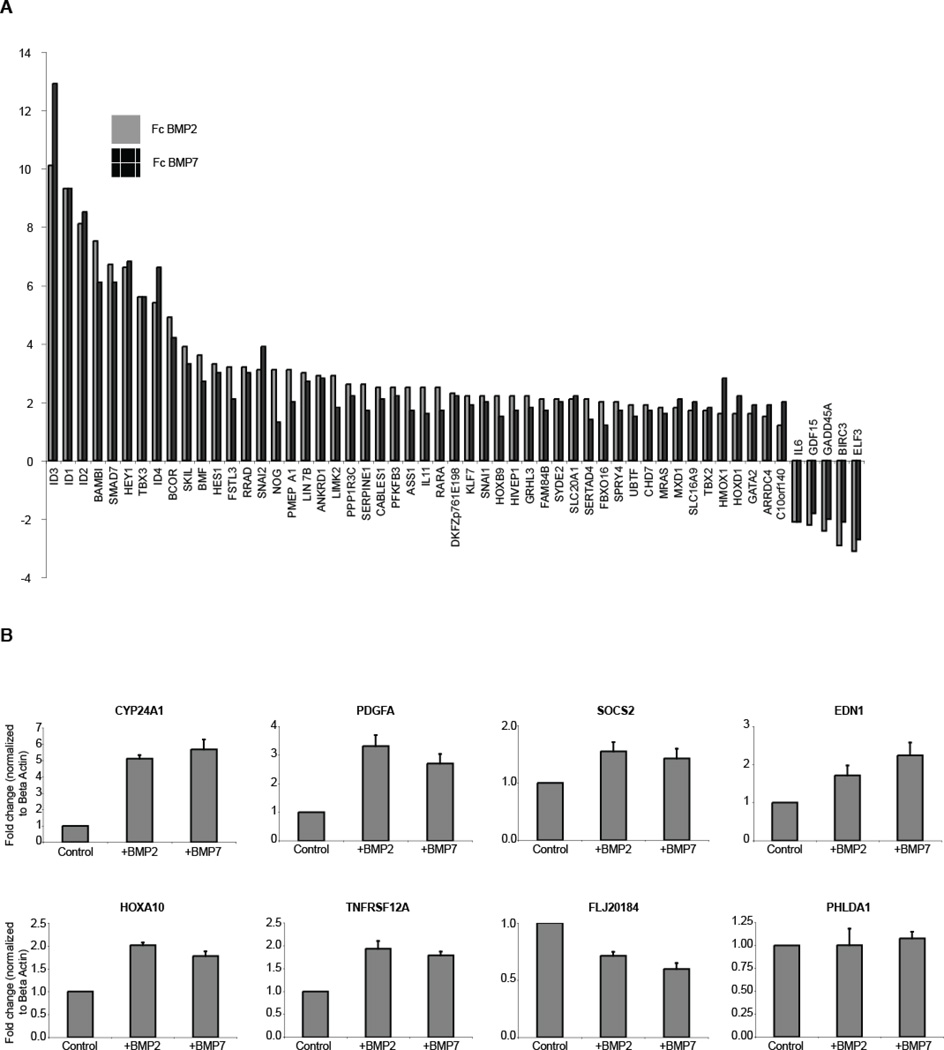
Figure 3. BMP2 and BMP7 stimulation of RPTECs produce closely related expression profiles.
A: Gene profiling of RPTECs stimulated for two hours with 50ng/ml of BMP2 or BMP7 shows extensive overlap. All candidates with a p-value < 0.01 are shown where stimulation with either ligand resulted in a > +/− 1.75 fold change and both ligands drove expression in the same direction. B: A subset of genes suggested by the profiling to be differentially regulated by BMP2 and BMP7 were compared by qPCR and were regulated in a similar fashion.

