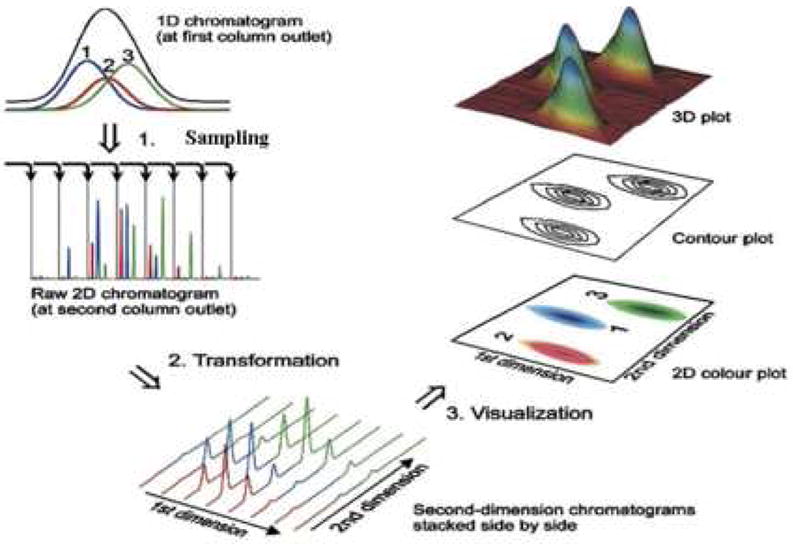
Figure 12.

Diagram of the flow of information as it is collected and analyzed in a comprehensive 2D separation experiment. Step 1 shows that the collection and transfer of aliquots of first dimension column effluent and subsequent separation in the second dimension column produces a series of sequential second dimension chromatograms collected as one string of data. Steps 2 and 3 show how the sequential second dimension chromatograms can be reshaped to produce a variety of different representations of the 2D chromatogram. Adapted from ref. [16].
