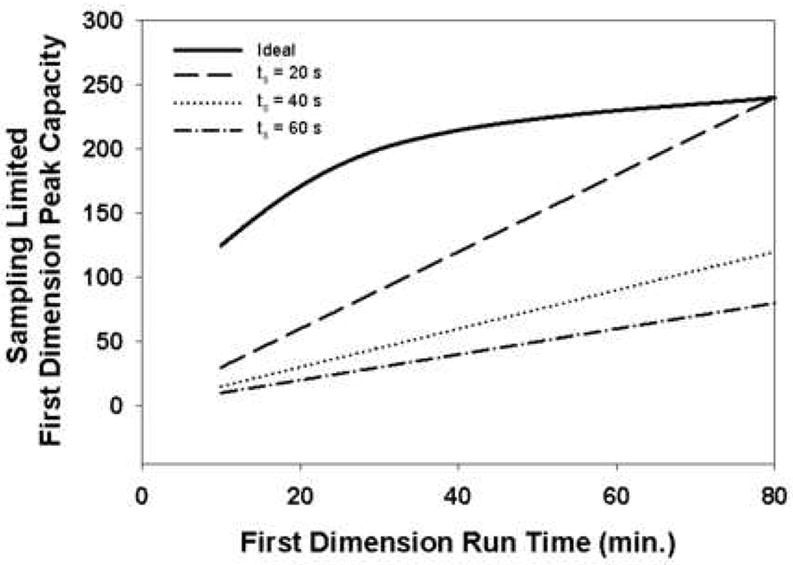
Figure 15.

Effect of slow first dimension sampling compared to first dimension peak width on first dimension peak capacity. The ideal first dimension peak capacity (——) is calculated for a diverse mixture of peptides using the method of Wang et al. [66] at 40 °C and assumes no effect of undersampling. The other three curves are calculated by simply dividing the analysis time by the sampling time (ts).
