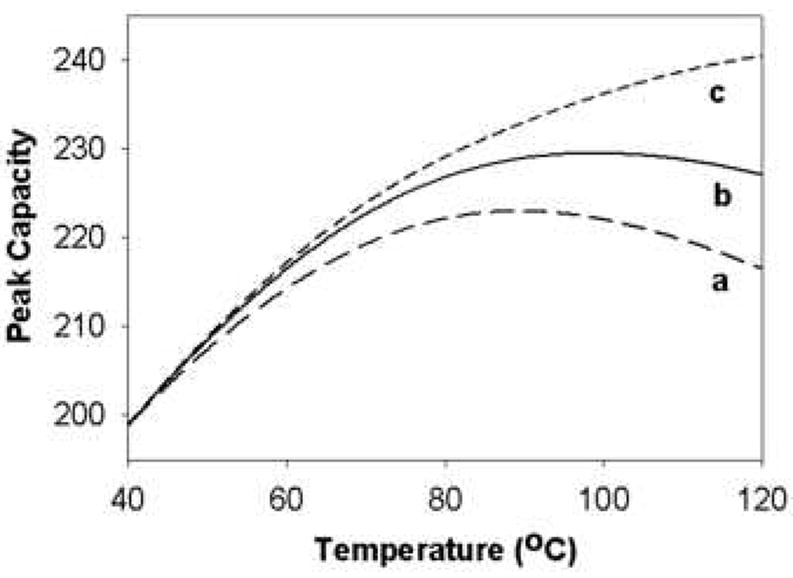
Figure 22.

Effect of temperature on peak capacity of eleven peptides in three cases. Case a: ϕf is kept constant at 0.409 (– –); Case b: ϕf is optimized by Solver to maximize peak capacity (—); Case c: Both ϕf and flow rate are simultaneously optimized by Solver to maximize peak capacity (----). From ref. [66].
