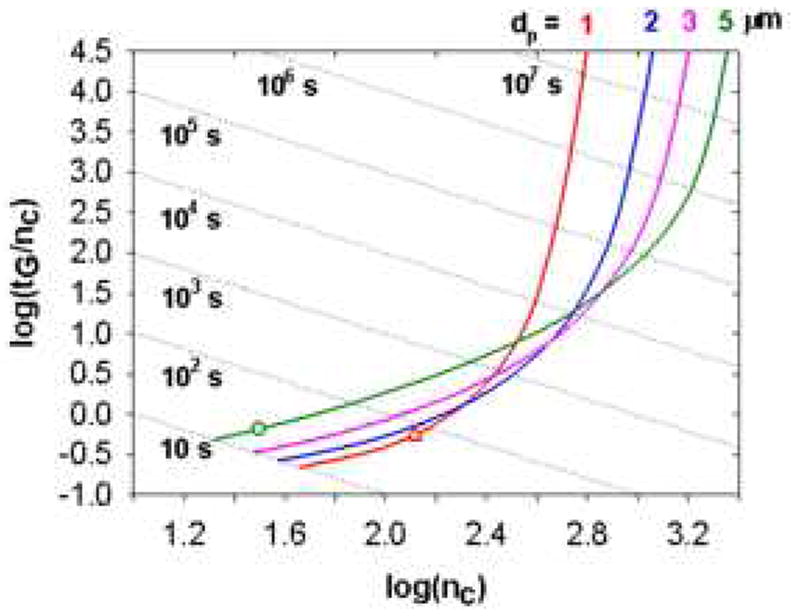
Figure 24.

Effect of particle size on gradient elution Poppe plots. Sample was a mixture of eleven representative peptides. Conditions: ΔP = 400 bar, T = 40 °C, ϕ = 500, η = 0.69 cPoise. Diffusion coefficients of the peptides were estimated using the Wilke-Chang equation. Coefficients of the reduced van Deemter equation were measured on a 50 × 2.1 mm 3.5 μm Zorbax SB-C18 column using heptanophenone in 40 % acetonitrile (v/v) at 40 °C (k’ = 20): A = 1.04, B = 15.98, C = 0.033. Open triangles represent the points where the column length is 1.0 cm and open circles represent the points where the flow rate is at 5.0 mL/min. Each dotted line represents a constant gradient time. From ref. [105].
