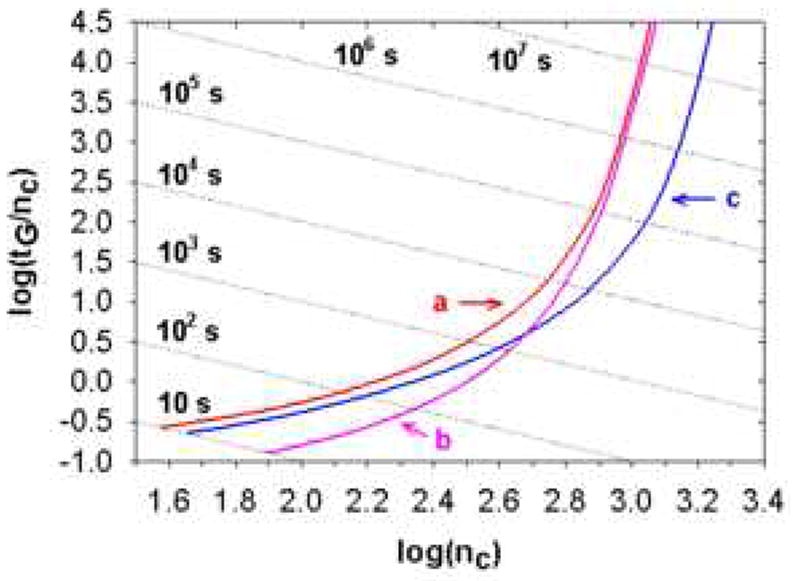
Figure 25.

Effect of operating temperature and maximum pressure drop with 2 μm particles on gradient Popple plots for packed beds. Curve a: T = 40 °C, ΔP = 400 bar (normal temperature and typical maximum pressure). Curve b: T = 100 °C, ΔP = 400 bar. Curve c: T = 40 °C, ΔP = 1000 bar. Other conditions are the same as Fig. 19. From ref. [105].
