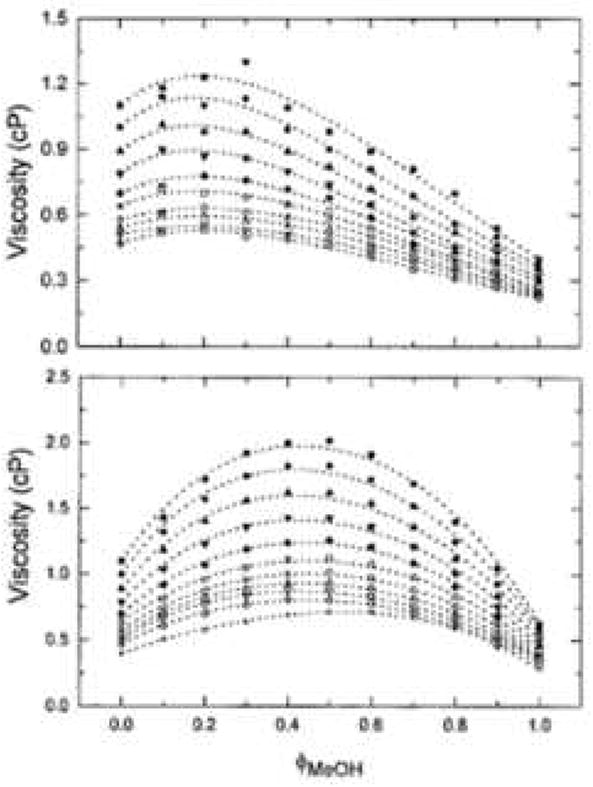
Figure 26.

Effect of mobile phase composition and temperature on viscosity. Experimental data and fitted curves for the viscosity of (A) acetonitrile/water, (B) methanol/water mixtures at different temperatures. Symbols, temperature (°C, top to bottom): 15; 20; 25; 30; 35; 40; 45; 50; 55; 60. From ref. [109].
