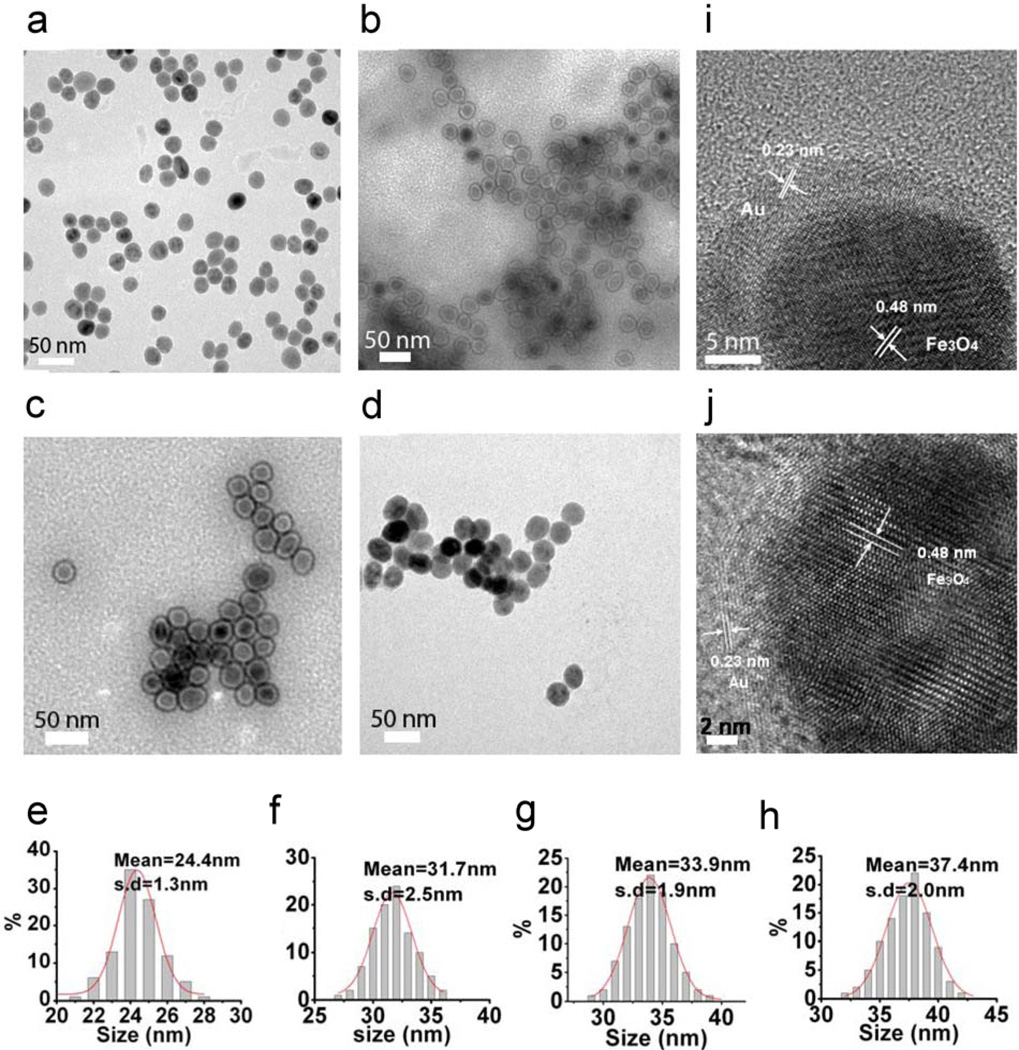
Figure 2. TEM imaging of the MNP-gold coupled agents.
(a–d) TEM images and (a1–d1) size distribution histograms of (a) PL-PEG-COOH / PLH coated MNPs (polymer layer not visible under TEM due to low electron density), and (b–d) MNP-gold core-shell NPs with various shell thickness (b, ~1–2 nm; c, 2–3 nm; d, 4–5 nm). The particle size histograms in a1–d1 are plotted from analysis of > 150 particles for each sample. (e&f) Representative HR-TEM images of MNP-gold core-shell NPs with shell thickness of ~ 2–3 nm. The lattice spacing of the MNP core measures at 0.48 nm corresponding to the (111) plane of Fe3O4; whereas the (111) plane of face-centered cubic (fcc) Au shows 0.23 nm lattice spacing.

