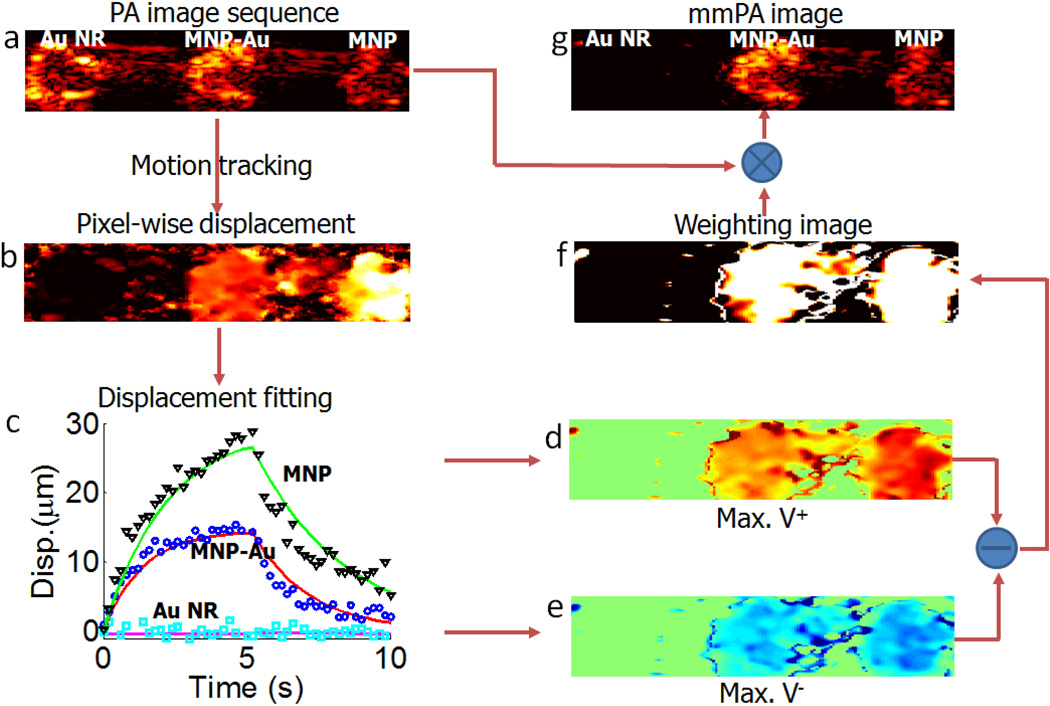
Figure 5. Data processing in mmPA imaging of MNP-gold hybrid NPs in comparison with gold nanorods and MNPs.
A conventional PA image (a) sequence was acquired in synchrony with a magnetic pulse. (b) The maximum displacement achieved at the end of the magnetic pulse tracked using this sequence with the magnetic pulse spanning the first 5 seconds. (c) Three representative displacement courses and their fitted curves for pixels in different inclusions. The maximum positive (d) and maximum negative (e) velocities were derived from fitted displacement curves, and used to create a weighting image (f). The product of (a) and (f) produced an mmPA image (g), where the gold nanorod inclusion is completely suppressed. The display ranges are 40 dB dynamic range in (a) and (g), [0 (dark), 30 (light)] µm in (b), [−20, 20] µm/s in (d) and (e) with −20 µm/s, 0 µm/s, and 20 µm/s corresponding to dark blue, green, and dark red, respectively, and [0, 1] in (f).

