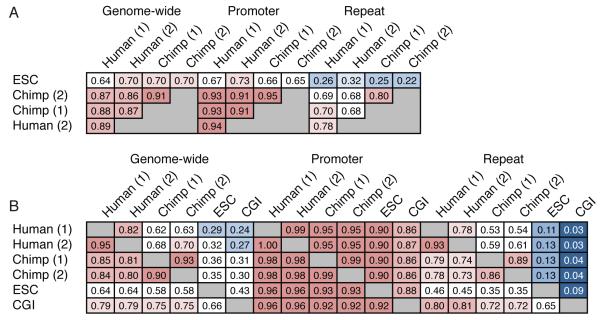
Figure 1. A global view of sperm and ESC methylomes.
A. Correlations between methylomes with methylation levels measured at individual CpG sites. Correlations are displayed for CpGs genome wide, within promoters and within repeats, and correlation coefficients are colored blue to red to indicate low to high, respectively.
B. Overlap between sets of HMRs from human sperm, chimp sperm and ESC methylomes, along with annotated CGIs. Each cell gives the fraction of HMRs corresponding to the row that overlap HMRs corresponding to the column. Colors are overlaid as in A.
See also Supplementary Tables 1

