
Figure 3.
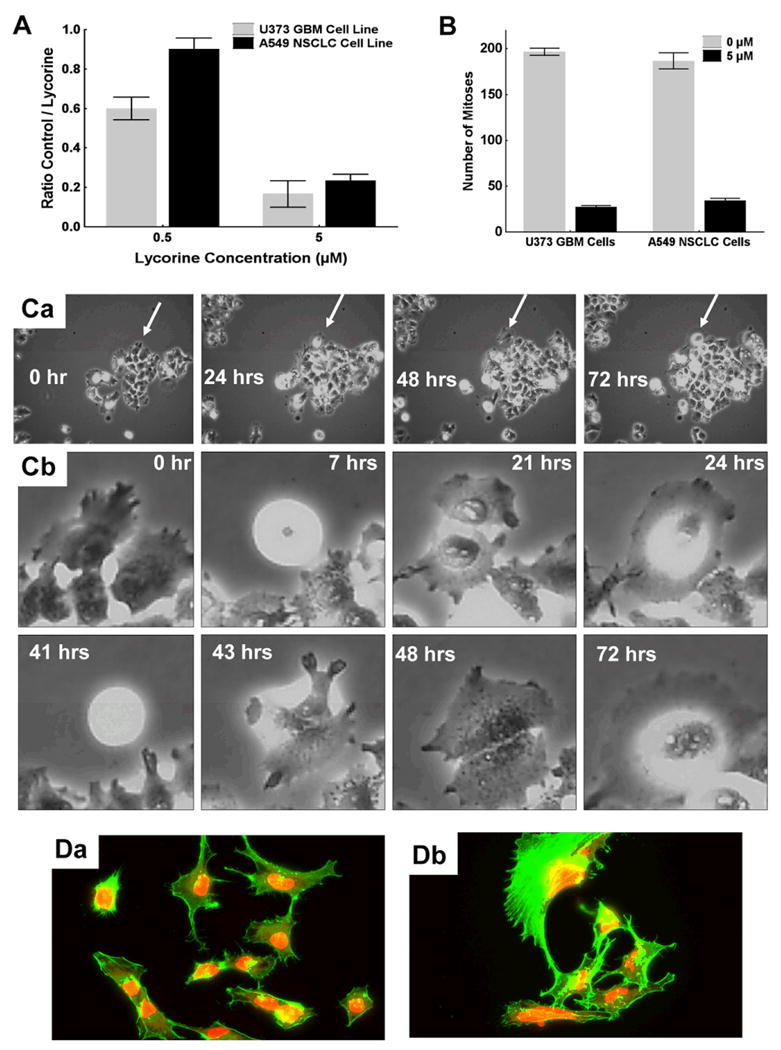
A: In each (control or treated) set of conditions, the cell growth levels after 72 hrs of culture were evaluated by the ratio of the numbers of cells counted in the last and first frames of the image sequence. The global growth ratio (GGR) for a given set of experimental conditions was defined by the ratio of the two growth levels obtained in the control and the treated conditions (control / treated). All the cell counts were performed in triplicate using an interactive computer tool. A GGR value of 0.6 in Fig. 3A means that 60% of cells grew in the treated as compared to the control set of conditions. B: the number of mitoses occurring in a 2 mm2 frame during 72 hrs of observation was quantitatively determined with computer-assisted phase-contrast microscopy (quantitative videomicroscopy) utilizing software packages developed in our laboratory.32 Ca: a A549 NSCLC colony was treated with 5 μM lycorine and then observed by means of quantitative videomicroscopy with the focus on the single cell indicated with the white arrow. Cb: behavior of the single cell indicated with a white arrow in Ca was monitored for 72 hrs. D: immunofluorescence analyses were performed to reveal in green fluorescence the fibrilar (polymerized) actin and in red fluorescence the globular (non polymerized) actin in U373 GBM cells (Da: control; Db: 5 μM lycorine for 6 hrs).