
Figure 4.
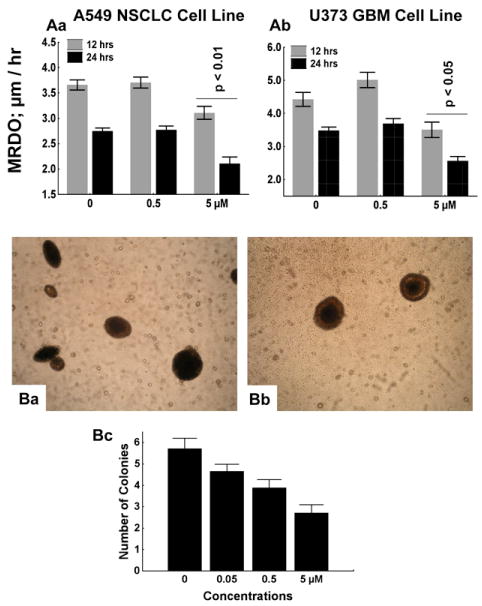
A: Characterization of the effect of 0.5 and 5 μM lycorine (0 μM = control) on migration levels of A549 NSCLC and U373 GBM cells. Migration levels were determined by computing the MRDO variable (by means of quantitative videomicroscopy), which represents the Maximal Relative Distance to the Origin (the largest linear distance) travelled by each single cell during 12 (the gray bars) or 24 (the black bars) hrs of observation. Data are presented as means ± SEMs. Morphological illustrations of MRDO variable computation are provided in reference #50. B: morphological illustrations of A549 NSCLC cell colonies developing on soft agar for 38 days after cell plating procedure without (control; Ba) or with 5 μM lycorine (Bb). The number of colonies was determined in three 0.4-mm2 areas for each set of experimental conditions, which was repeated as hexaplicate. Data are presented as means ± SEMs.