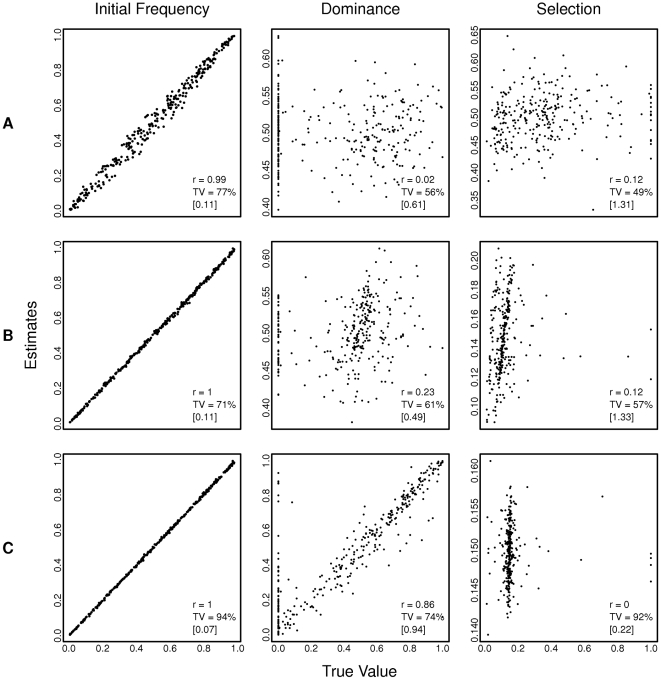
Figure 5. Effect of temporal heterogeneity on estimates of initial allele frequency, dominance and selection coefficients parameters.
Three different scenarios were simulated: (A) dominance and selection are different in every generation, (B) selection coefficient was held constant in all generations but dominance was allowed to vary, (C) dominance was held constant in all generations while the selection coefficient was allowed to vary. The Pearson correlation coefficient (r) between estimate and true value is shown. TV refers to the percentage of the true values that are included in the 95% confidence interval of the estimate. [ ] is the mean range of the 95% confidence interval in all runs.

