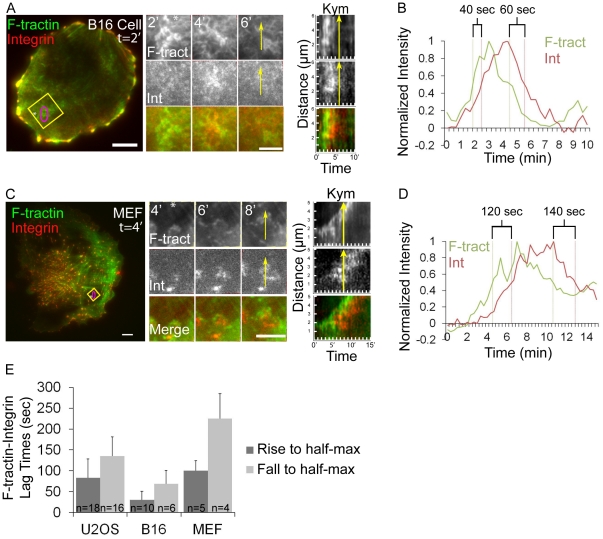
Figure 2. Melanoma and fibroblast cells exhibit ventral F-actin waves followed by integrin waves.
(A, C) LEFT: Total internal reflection microscopy (TIRFM) image of a B16-F10 cell (A) or a primary mouse fibroblast (C) co-expressing F-tractin-GFP to label actin filaments (green) and αV integrin-tagRFP (red). The white asterisk is to aid in orientation of the region. Scale bar = 10 µm. CENTER: Images from a time-lapse series of the region highlighted by a yellow box, time in min shown. The white asterisk is to aid in orientation of the region. Scale bar = 5 µm. RIGHT: Kymograph (Kym) along the trajectory of ventral F-actin wave propagation (highlighted with a yellow arrow a t = 6 min(A) and t = 8 min(C)) demonstrates that F-tractin-GFP temporally precedes αV integrin-tagRFP in ventral F-actin waves. (B, D) Normalized average intensity of F-tractin-GFP (green) and αV integrin-tagRFP (red) over time. The average intensity in the green and red channels was measured in the region highlighted by a magenta circle in (A,C, left) and the values were normalized to the maximal intensity in the time series. To quantify assembly dynamics, we measured the lag time between when ventral F-actin and integrin waves reached half-maximal intensity. To quantify disassembly dynamics, we measured the lag time between when ventral F-actin and integrin waves fell from peak to half-maximal intensity. Lag times are labeled in (B, D). (E) Average lag times determined as described in (B,D) for the cell types noted, represented as mean ± SD, n = number of ventral F-actin waves analyzed.

