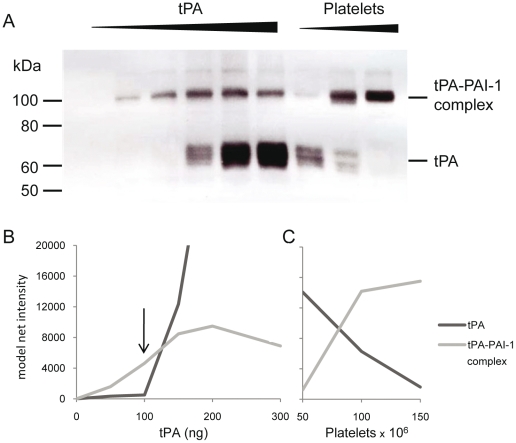
Figure 1. Western blot analysis of tPA-PAI-1 complex in dilutions of platelets and tPA.
A. The platelets were incubated with tPA and were lysed in buffer with Triton X-100. Lane 1–6; constant number of platelets (in this case 400×106) lysed in the presence of increasing amounts of tPA (0 ng–300 ng). Lane 7–9; constant amount of tPA (100 ng) and increasing number of platelets (50×106–150×106). The membrane is incubated with tPA mab PAM-3. B and C. Densitometric evaluations of the tPA and the tPA-PAI-1 complex. In fig B the band intensity is plotted against the tPA concentration in the sample. In figure C the intensity is plotted against the number of platelets (×106) in the sample. The arrow indicates the tPA concentration selected for PAI-1 activity calculation.

