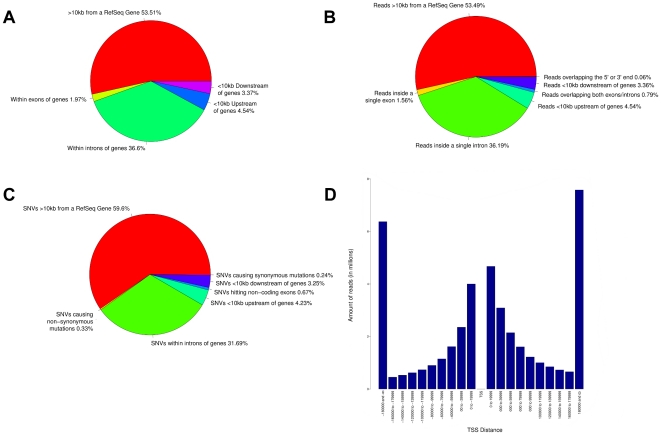
Figure 5. Example of statistics that can be obtained by running Segtor on 42,652,991 uniquely aligned Illumina reads and 2,707,221 putative SNVs.
This graph represents the annotation modes for which statistics are available namely, annotation of a) coordinates, b) intervals, c) SNVs and d) closest TSS. A range of 10kb was used for our definition of upstream/downstream.

