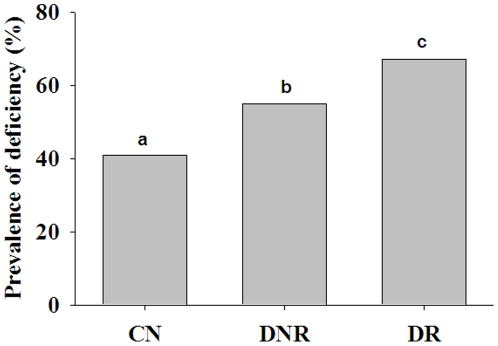
Figure 4. Prevalence (%) of vitamin-B12 deficiency in control (CN) and diabetes patients without (DNR) and with retinopathy (DR).
Data indicate percent of subjects below 200 pg/mL of the respective group. Proportion Z test was done to compare prevalence between groups. Significant differences (p<0.001) of mean values between the groups are indicated by different letters on the bars.

