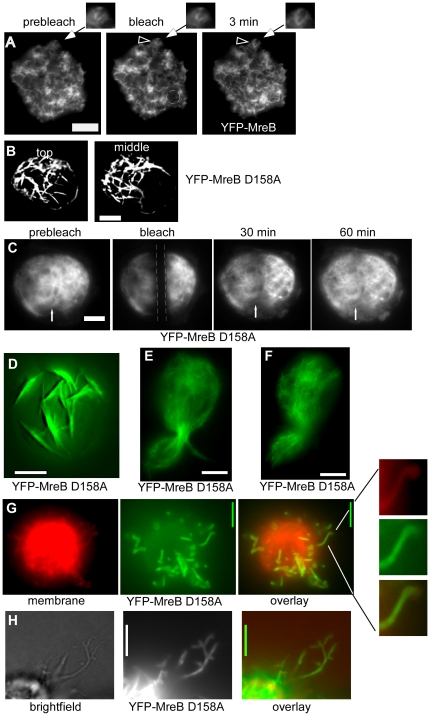
Figure 3. Expression and FRAP experiments of MreB and mutant versions in S2 cells.
A) FRAP experiment; an area indicated by a dashed circle is bleached; “min” indicates time after bleaching, clear YFP-MreB filaments can be seen after 3 min. Triangle indicates a filamentous structure that changes within the 3 min interval, which is enlarged in the images above. B) Top plane from a 3D deconvoluted stack of a cell expressing YFP-MreB D158A mutant, C) FRAP experiment of mutant MreB D158A, the stretch indicated by dashed lines is bleached, the white arrow indicates a structure that has recovered after 30 min. D) 3D deconvoluted image of YFP-MreB D158A 5 hours after induction, many of which are still attached to the cell membrane. E) YFP-MreB D158A 12 hours after induction (middle plane), F) YFP-MreB D158A 24 hours after induction (middle plane). G) Top view of a 3D deconvoluted stack of a cell expressing YFP-MreB D158A which forms extrusions that are covered with the cell membrane (one such region is enlarged on the right. Note that the cell membrane is below the focal plane and appears as a haze. H) YFP-MreBD158 protrusions observed by bright field illumination. White bars 2 µm.

