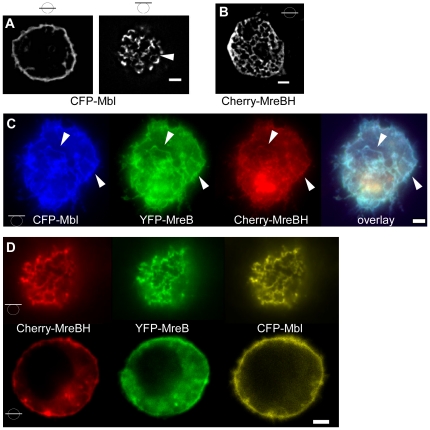
Figure 5. Expression of MreB paralogs in S2 cells.
A) 3D deconvoluted images of CFP-Mbl, B) 3D deconvoluted image of mCherry-MreBH (middle plane). Bars in circles indicate position of image planes. C) Top view of a cell expressing YFP-MreB, CFP-Mbl and mCherry-MreBH, triangles indicate identical structures. D) Top and middle plane of a cell expressing all three MreB paralogs. White bars 2 µm.

