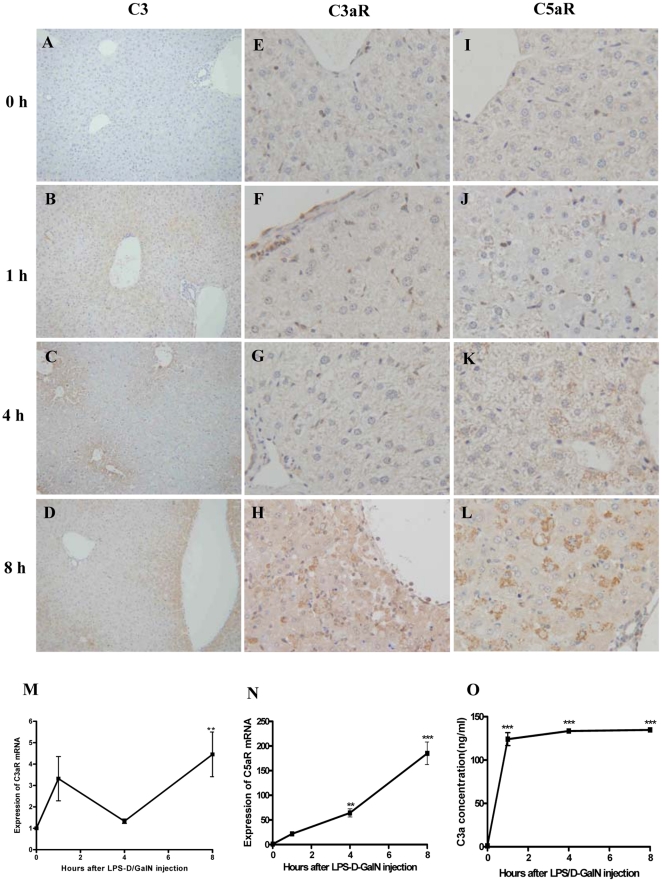
Figure 1. Complement activation following LPS/D-GalN injection.
Wt C57BL/6 mice were injected i.p. with LPS/D-GalN and euthanized at 0, 1, 4 and 8 hours after the injection. (A–L) Immunohistochemical staining for C3, C3aR and C5aR in liver sections after the LPS/D-GalN injection. (M–N) The relative C3aR mRNA and C5aR mRNA expression levels were determined in live tissue at the indicated time points after the LPS/D-GalN injection. The mRNA expression was determined by relative quantitative real-time PCR analysis. The results are expressed as the means±SEM relative to GAPDH expression. (O) The serum concentrations of C3a at the indicated times after the LPS/D-GalN injection. ** and *** indicate p<0.01 and p<0.001, respectively. n = 6–7 per group. The original magnification for C3 of stained images: ×200; for C3aR and C5aR of stained images: ×800.

