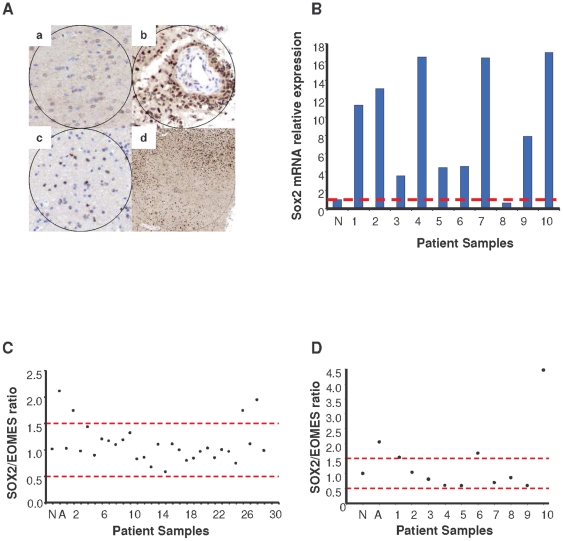
Figure 1. Molecular analysis of Sox2 in GBM specimens.
A. Sox2 was overexpressed at the protein level in GBM samples. Representative micrographs of Sox2 immunostaining in GBM samples (n = 30). a, normal white matter with slight cytoplasmic staining in the cytoplasm; b, GBM with intense nuclear staining in tumor cells and no vascular staining; c, Sox2-positive infiltrating cells in normal tissue around the tumor (20×); d, infiltrative border with Sox2-positive tumor cells (4×). B. Sox2 was overexpressed at the mRNA level in GBM samples. This panel illustrates the relative Sox2 mRNA expression levels in 10 GBM samples. The red dashed line represents the normal threshold. N = normal brain. C and D. Amplification of Sox2 in the two independent cohorts (left, 30 GBM samples; right, 10 GBM samples). N = normal human astrocytes; A = leukemia cell line TF1 (amplified Sox2). The red dashed lines represent the normal threshold.

