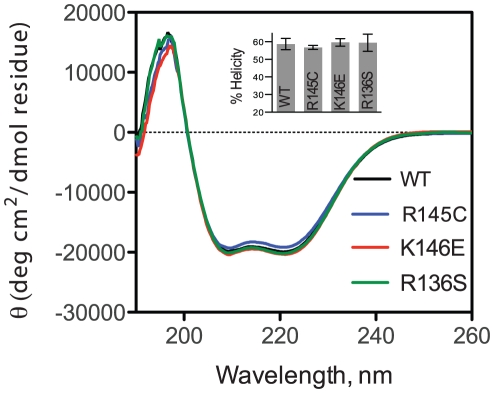
Figure 2. Circular dichroism spectra of wild-type apoE3 and variants (wild-type in black, R145C in blue, K146E in red and R136S in green).
Spectra shown are the average of three separate measurements on different days with different protein batches. Inset: Helical content of WT apoE3 and variants calculated using the molar ellipticity at 222 nm as described in the materials and methods section. Error bars represent standard deviation based on three independent measurements.

